Distinguish between PA6 and PA66 in seconds
PA6 and PA66 are among the most widely used plastics in the world. However, a simple differentiation is tricky and only possible with (time-consuming) laboratory work. There is often not enough time for these tests, especially in the incoming goods department. Near-infrared technology closes the gap and helps to separate the two plastics.
No forwarding agent waiting
A familiar situation at many plastic silos around the world: the articulated lorry with the delivery drives onto the company premises and is to be unloaded immediately.
As PA6 and PA66 hardly differ chemically, it is not possible to carry out a simple burn test directly on site. However, processing in the laboratory requires a considerable amount of time and money.
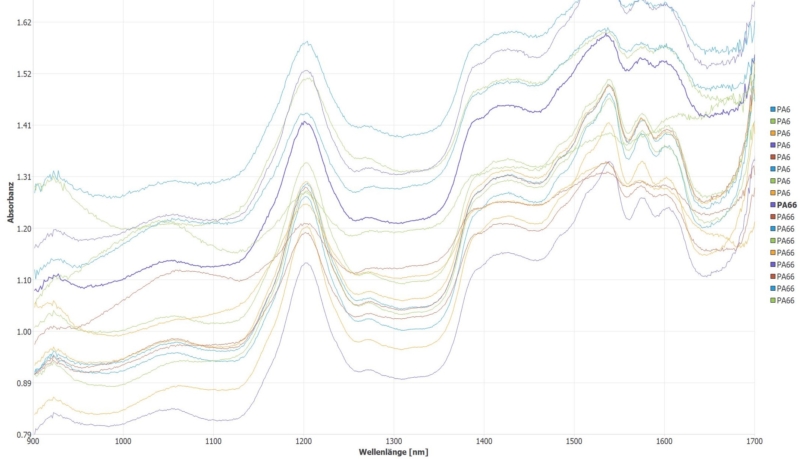
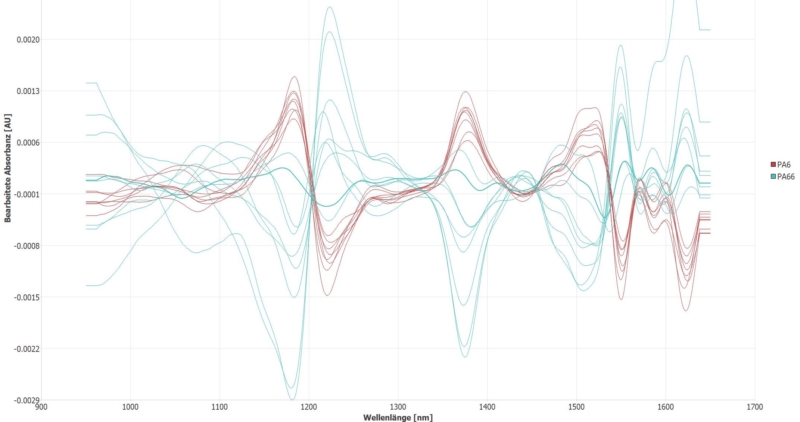
Differential display shows clear differences in the NIR spectrum
The difference display also does not appear as clear as desired at first glance. However, there are clear differences between the samples at the wavelengths 1,190 nm, 1,220 nm, 1,375 nm, 1,400 nm and 1,620 nm:
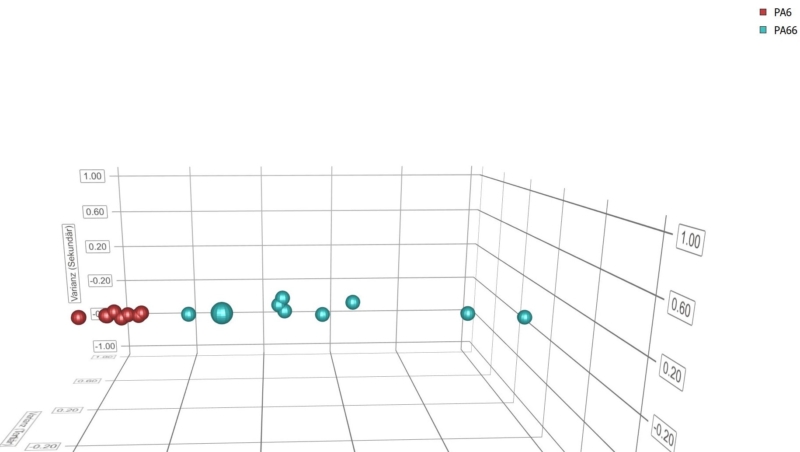
3D cluster display clearly groups large numbers of NIR spectra
What is only hinted at in the difference display is clearly shown in the 3D cluster display: the material of the PA6 sample appears to be more homogeneous: The spectra of the individual measurements hardly differ, recognizable by the spatial proximity of the spectra in the 3D cluster display.
Own references: Learn quickly
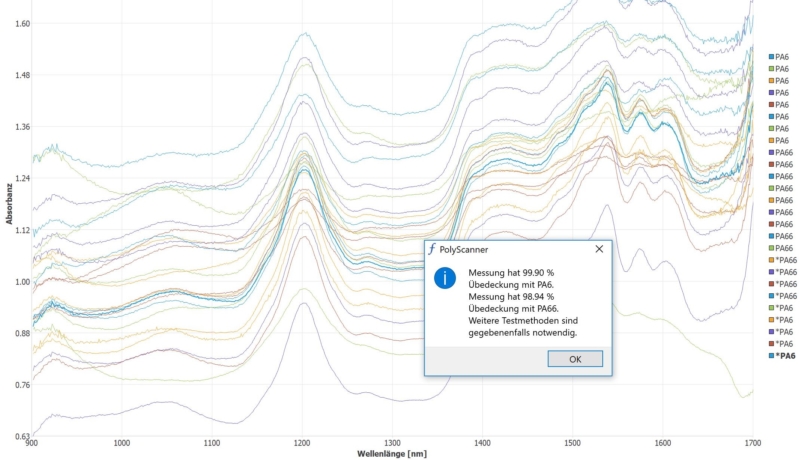
For this application, it makes sense to teach in the actual samples as separate references. The folder with the already saved and named spectra is stored as a reference database and automatic identification is activated.
For the counter sample, only the samples are held in front of the scanner: first 5x the PA66 sample and then 5x the PA6 sample. All samples are recognized correctly. In the user interface, the recognized substances are marked with an (*) in front of the material name.
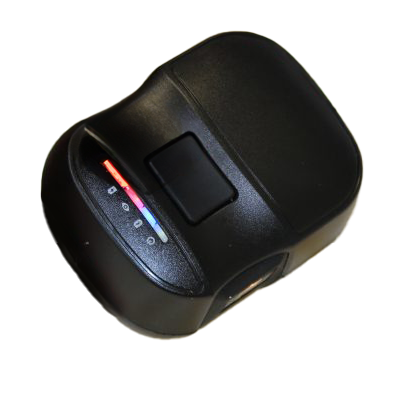
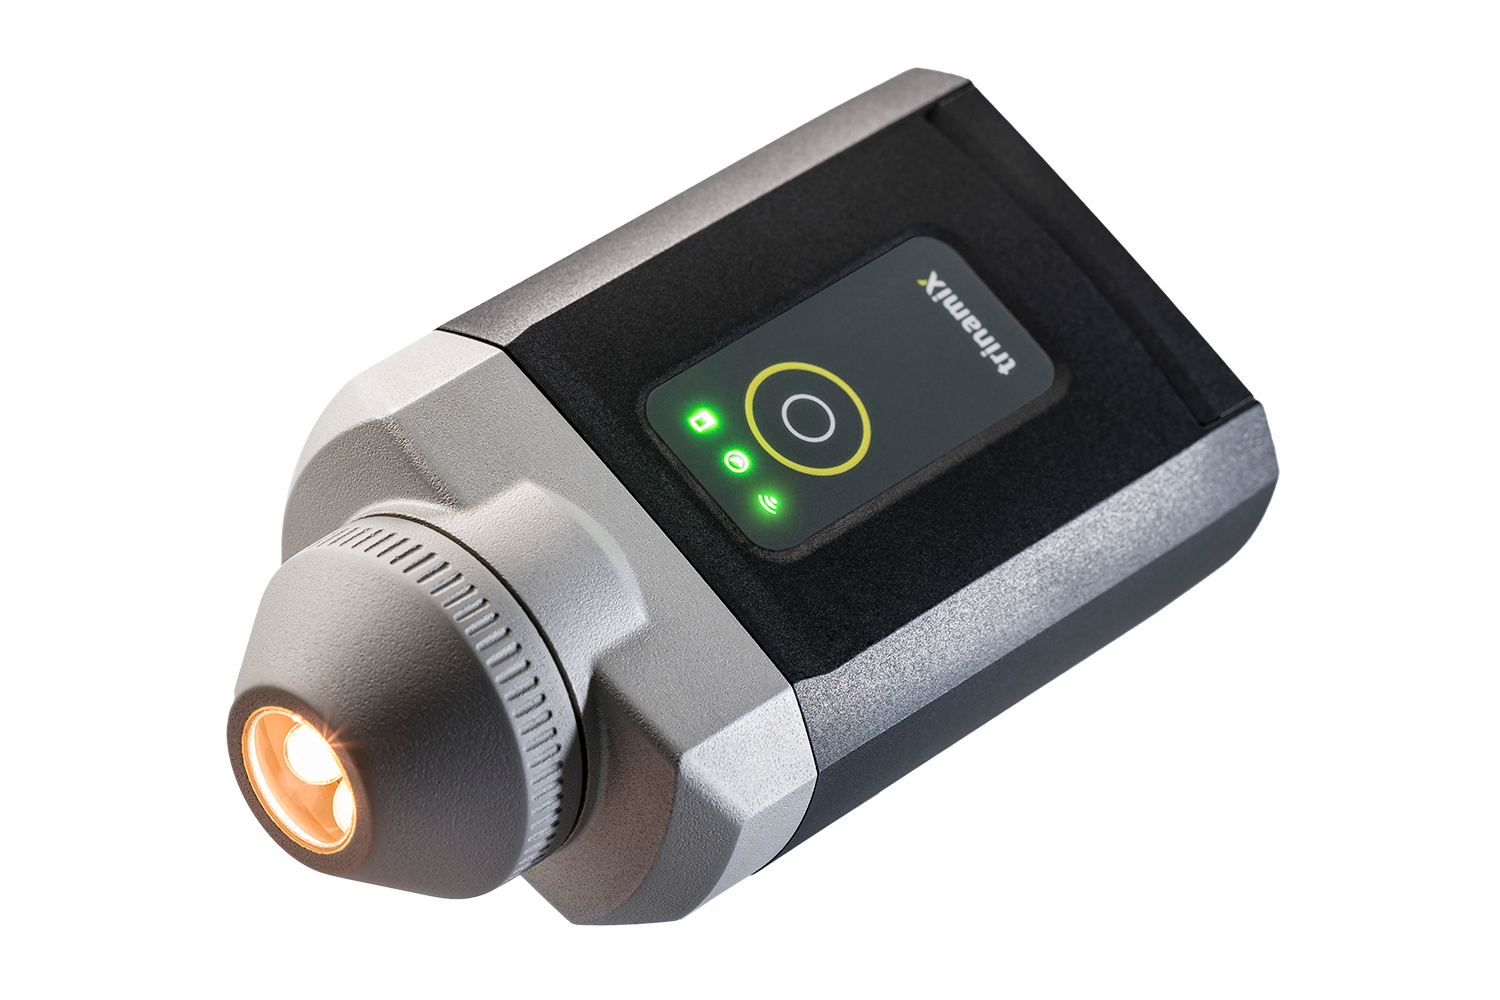
I now store this data as my own references for future measurements. A workstation equipped with a solid scanner and this reference data now enables even non-experts to check the silo delivery quickly, reliably and therefore very easily.
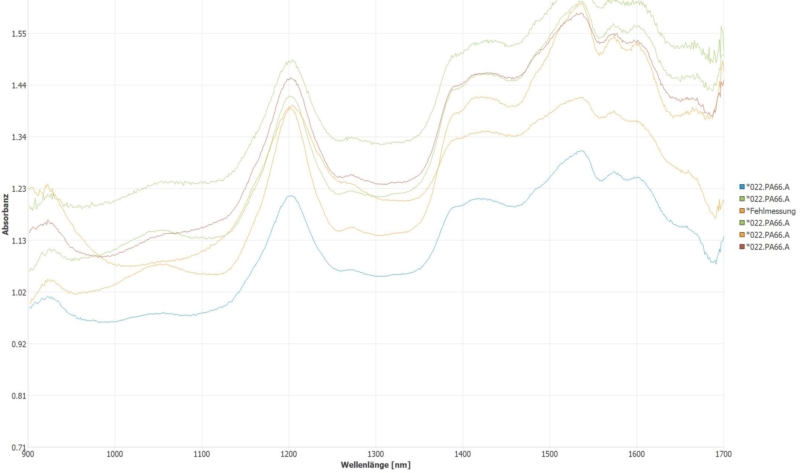
Absolute reference data: NIR spectra from the reference database
The Basis reference database also helps with identification:
Konfiguration
Für diese Beispielanwendung benötigen Sie folgende (Mindest-)Konfiguration:
Hardware
Software
NIR Referenzspektren
- Referenzdatenbank „Basis“ für Kunststoffe (für die Bestimmung unbekannter Kunststoffe)
Neugierig? Angebot für portables NIR Spektrometer anfragen
Falls ich Sie neugierig machen konnten und Sie weitere Informationen oder ein konkretes Angebot wünschen, schreiben Sie uns einfach.
Gerne diskutieren wir mit Ihnen, wie der Handscanner Ihre Prozesse vereinfachen und beschleunigen kann.


