Soft­ware suite for compact
NIR spectrometer

Whe­ther iden­ti­fy­ing unknown sub­s­tances, ana­ly­zing lar­ge amounts of data or sim­ply gene­ra­ting and saving NIR spec­tra in open data for­mat: the various soft­ware modu­les in our soft­ware suite cover a wide ran­ge of applications.

What is most striking, howe­ver, is the con­sis­tent reduc­tion of func­tions. By con­cen­t­ra­ting on the essen­ti­als, it is easy to get star­ted, even for non-experts. The various dis­play for­mats (raw spec­tra & clus­ter dis­play) allow the user to quick­ly under­stand how the soft­ware works and the cor­re­la­ti­ons in the data. The open data for­mat makes the data easy to use and under­stand and allows free editing: per­fect for get­ting star­ted in near-infrared spectroscopy!

Overview of available modules
  • Recor­der - The basic modu­le. For crea­ting, visua­li­zing and saving indi­vi­du­al spectra.

  • Play­er - The pre­re­qui­si­te for ever­y­thing else, regard­less of whe­ther it is our stan­dard appli­ca­ti­on for ana­ly­zing data or ful­ly deve­lo­ped appli­ca­ti­ons. The play­er plays all appli­ca­ti­ons and pro­ces­ses the data as required.

  • We offer stan­dard appli­ca­ti­ons for

    • the ana­ly­sis of data,
    • pla­s­tic iden­ti­fi­ca­ti­on and
    • the quan­ti­ta­ti­ve assess­ment of NIR detec­ta­bi­li­ty.
  • We can also deve­lop any num­ber of com­plex, cus­to­mi­zed appli­ca­ti­ons for you.

  • Data Mana­ger - This allows you to ana­ly­ze your data, inclu­ding using machi­ne lear­ning methods, and learn new data if the appli­ca­ti­on sup­ports this.

Software suite 1

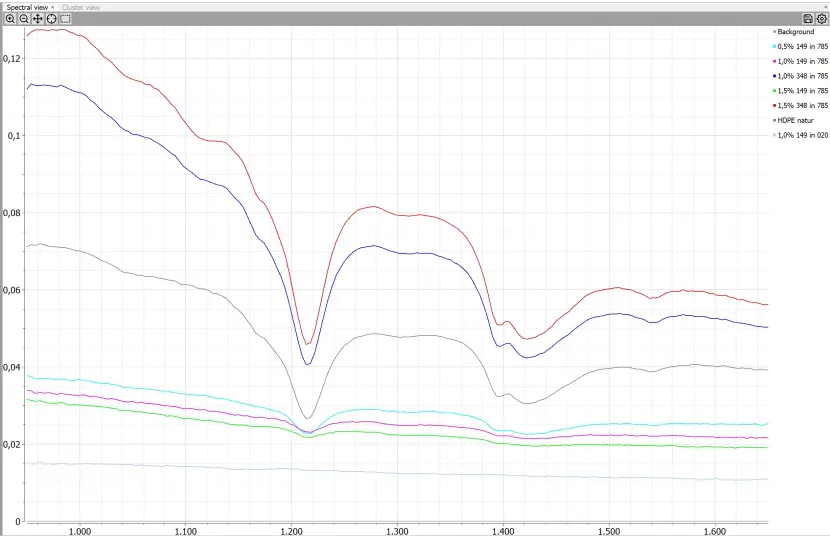
The avera­ge spec­tra of dif­fe­rent samples are com­pared direct­ly with each other (Data Manager).

Recorder

Visualization

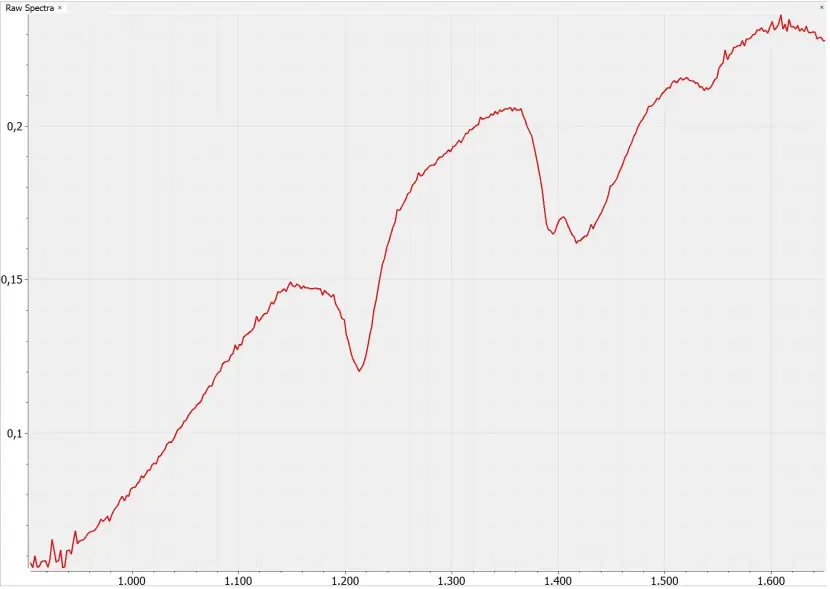
The data gene­ra­ted by the scan­ner is neither fil­te­red nor smoot­hed, i.e. you recei­ve the raw data. The basic modu­le is part of the scope of deli­very of the Solid Scan­ner.

Sui­ta­b­ly trai­ned employees can begin their own inter­pre­ta­ti­on of the mea­su­red spec­trum within a second. The qua­li­ta­ti­ve eva­lua­ti­on of the spec­trum is thus pos­si­ble. Distin­gu­is­hing “good” from “bad” NIR spec­tra is an instant suc­cess. Employees wit­hout expert know­ledge can deter­mi­ne pla­s­tics quick­ly and relia­bly with the help of the optio­nal­ly available applications.

Technical specification
  • Mul­ti­l­in­gua­lism (Ger­man and English)

  • Ope­ra­ting sys­tem from Win­dows 7 and Mac. Linux on request

  • Data import and export using JCAMP (.jdx, .dx; Joint Com­mit­tee on Ato­mic and Mole­cu­lar Phy­si­cal Data)

Software suite 2

The soft­ware modu­le dis­plays the pro­ces­sed mea­su­re­ment data as a raw spec­trum. The wave­length ran­ge extends from 900 nm to 1,700 nm.

Player

The play­er is a powerful tool. It plays all the appli­ca­ti­ons we pro­vi­de. We can draw on an exten­si­ve tool­box for development.

Our stan­dard applications:

  • Stan­dard analysis

  • Pla­s­tic identification

  • NIR detec­ta­bi­li­ty

Our indi­vi­du­al applications:

Here we take an indi­vi­du­al approach to your task, regard­less of whe­ther it is a modi­fi­ca­ti­on of a stan­dard appli­ca­ti­on or a com­ple­te­ly new appli­ca­ti­on deve­lo­ped exact­ly for your situa­ti­on: Talk to us!

… we look for­ward to sup­port­ing you with our expertise.

Software suite 3

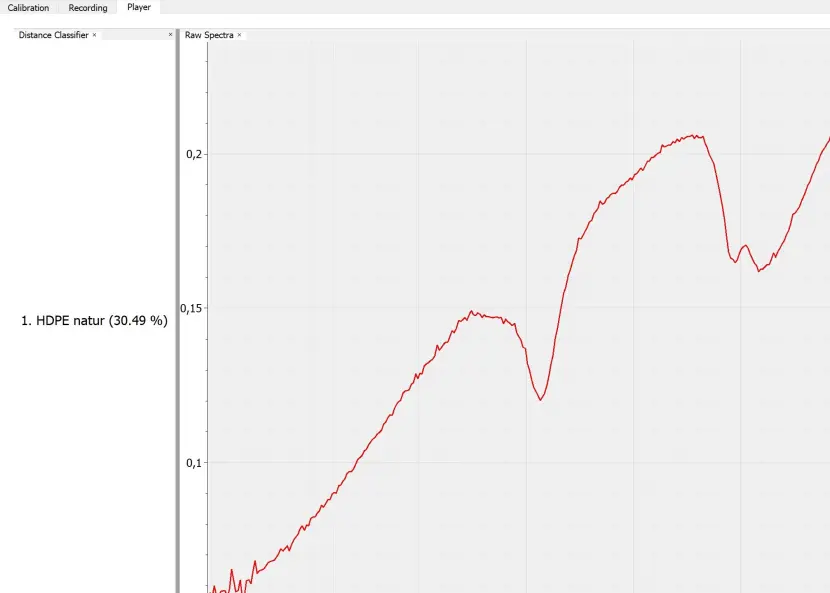
Cus­to­mi­zed appli­ca­ti­on. Deter­mi­na­ti­on of NIR detec­ta­bi­li­ty with HDPE natu­re as reference.

Data Manager

The Data Mana­ger helps you to ana­ly­ze new data and chan­ge the data of the appli­ca­ti­ons, if available. Con­cre­te examples:

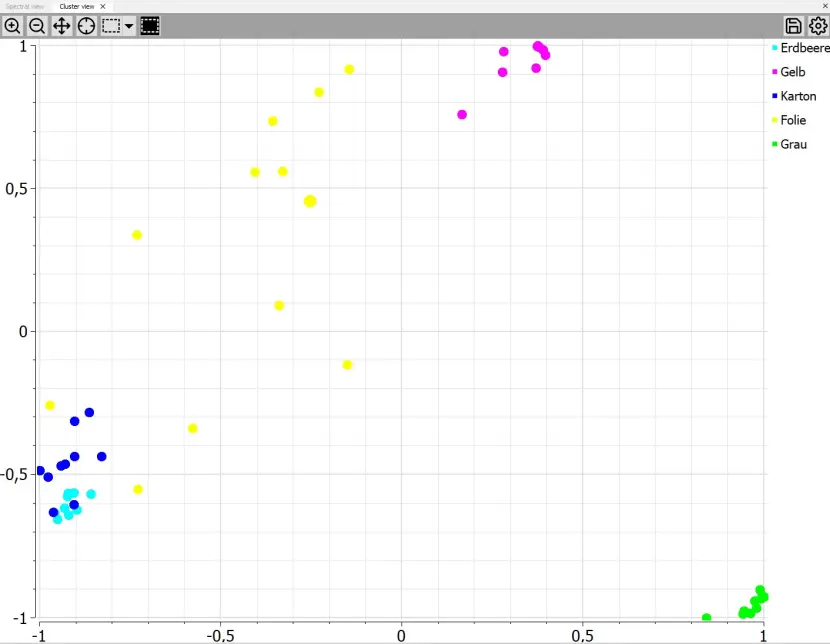
  • Stan­dard ana­ly­sis: You can use the Data Mana­ger to group spec­tra and then dis­play the avera­ge spec­tra of the­se groups. In the clus­ter view, you can use a prin­ci­pal com­po­nent ana­ly­sis to search for cor­re­la­ti­ons in lar­ge amounts of data. They reco­gni­ze homo­ge­neous and inho­mo­ge­neous mate­ri­als and can learn sui­ta­ble spec­tra as indi­vi­du­al groups. This allows you to crea­te your own appli­ca­ti­on, e.g. for inco­ming goods.

  • Pla­s­tic iden­ti­fi­ca­ti­on: This appli­ca­ti­on alre­a­dy con­ta­ins some pla­s­tics. If you want to chan­ge the com­po­si­ti­on of the data­ba­se, you can ana­ly­ze exis­ting and new data simi­lar to the stan­dard ana­ly­sis and update your data­ba­se accor­din­gly. In addi­ti­on, a sub­scrip­ti­on to this appli­ca­ti­on is recom­men­ded to ensu­re that you are always up to date.

  • NIR detec­ta­bi­li­ty: This appli­ca­ti­on includes PP and PE pla­s­tics as refe­ren­ces. For your own refe­ren­ces, exch­an­ge the exis­ting ones with your mea­su­re­ments and then update the application.

Software suite 4

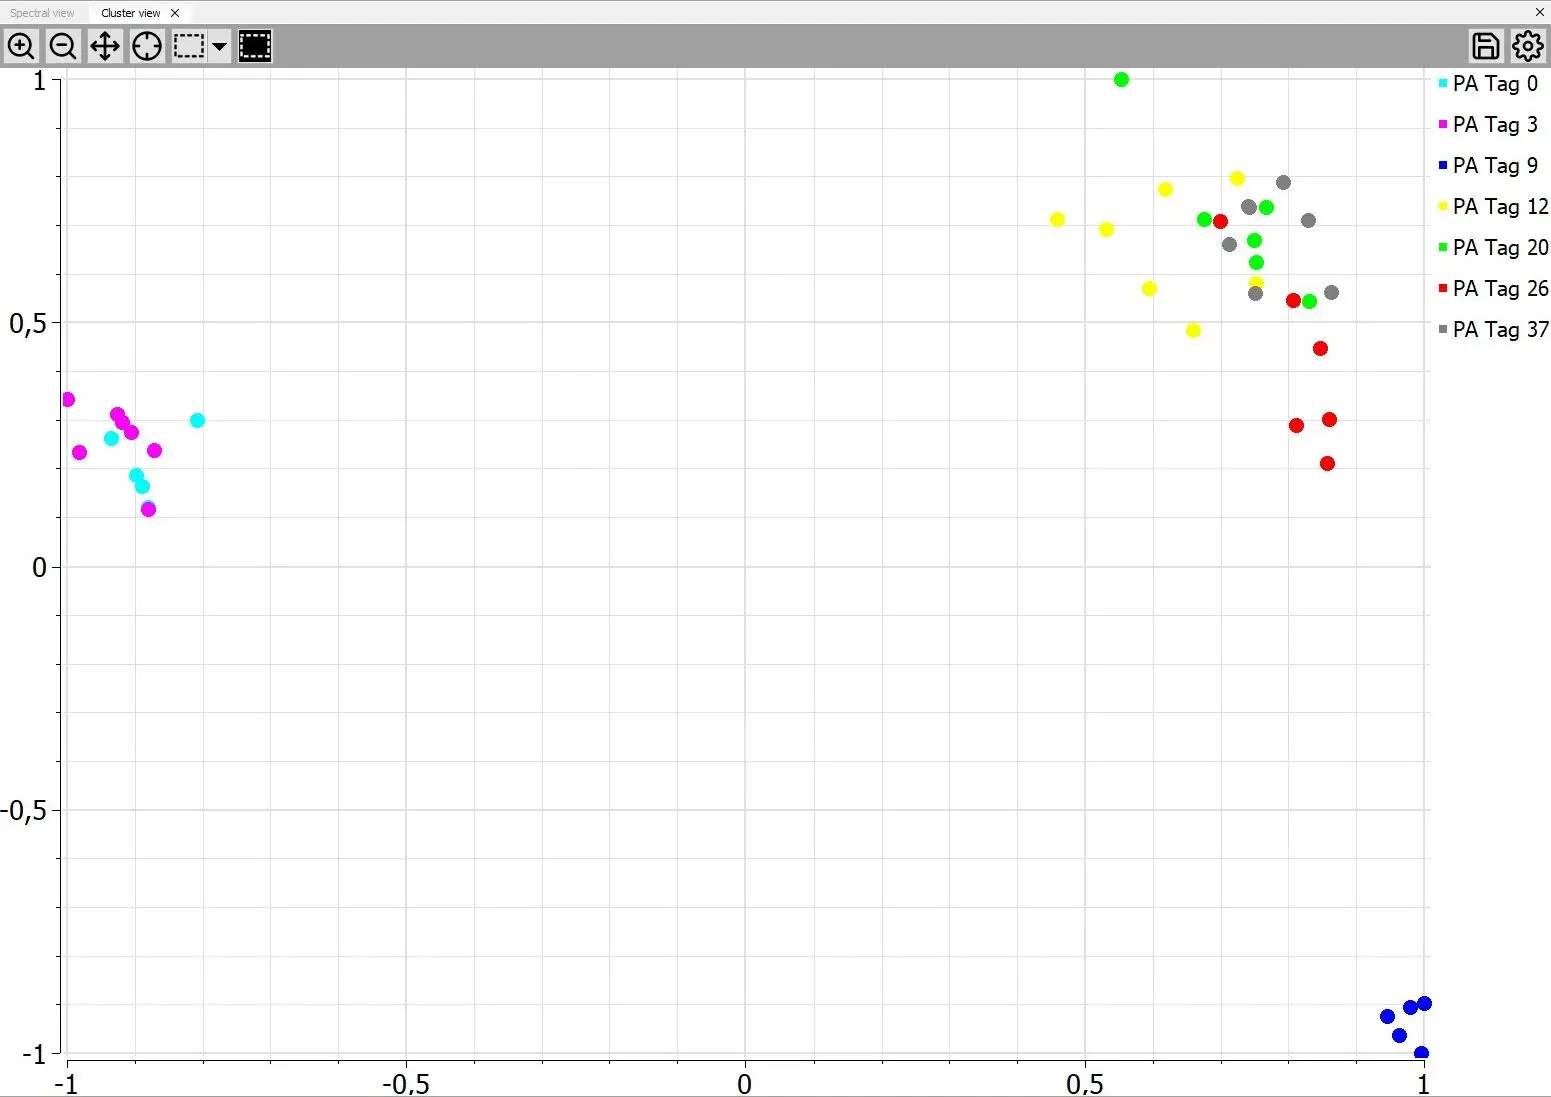
Stan­dard ana­ly­sis: 3 groups can be cle­ar­ly distin­gu­is­hed here: Blue/Turquoise, Red & Green. The mea­su­re­ments in yel­low show too high a scat­te­ring and can­not be meaningful­ly taught in as a group in this application.